VisiData Tour
Example query: using birdsdiet.tsv, what is the relationship between the diet and average mass of passerine birds?

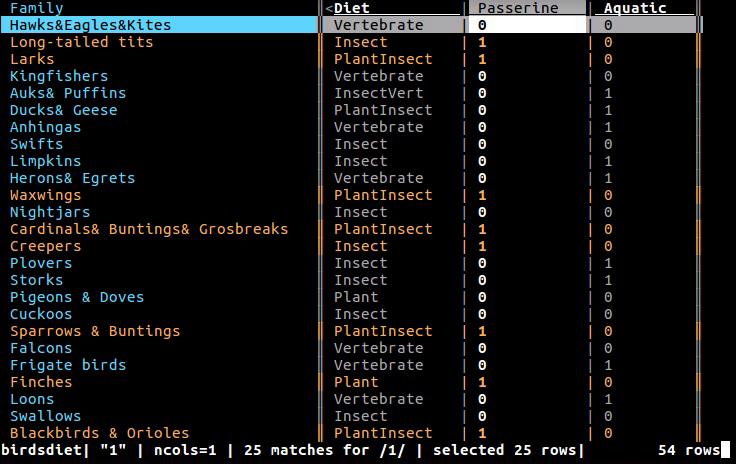
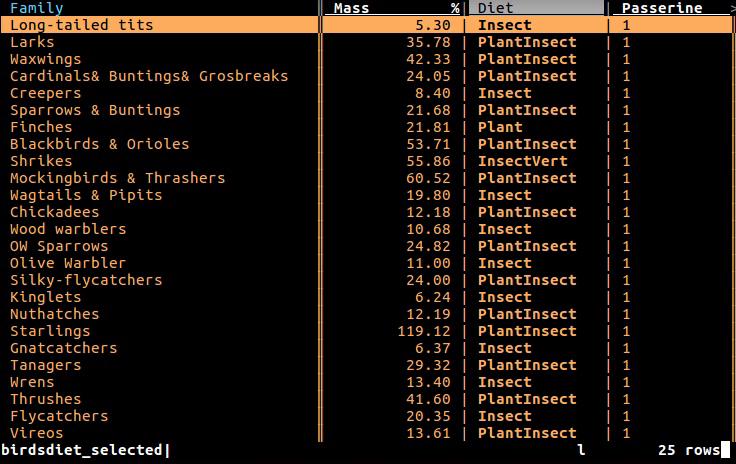
1. Open the data at the terminal with vd birdsdiet.tsv |
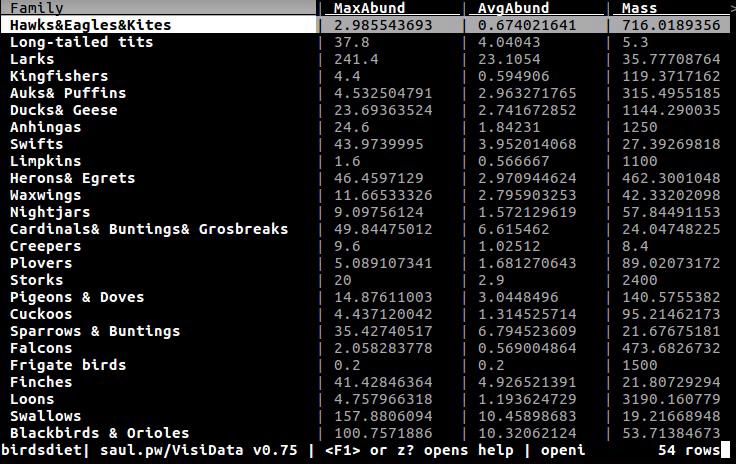
|
|||||||||||
2. Toggle the Family column to be a key column with ! |
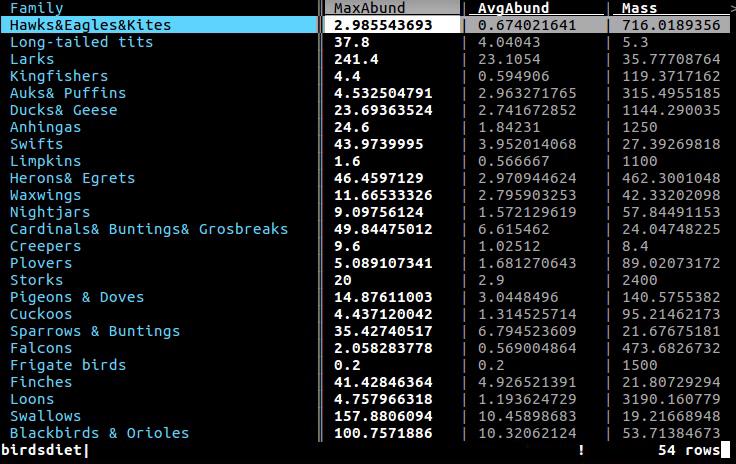
|
|||||||||||
3. Hide undesired columns with - |
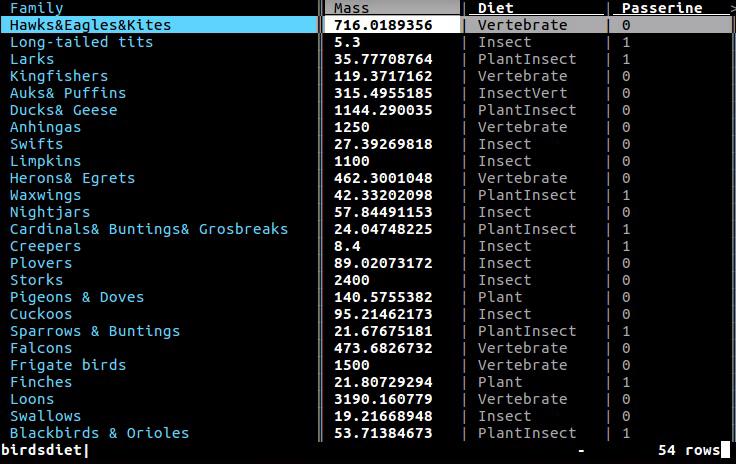
|
|||||||||||
4. Set the Mass column to the float type with % |

|
|||||||||||
5. Go to the Passerine column with l |
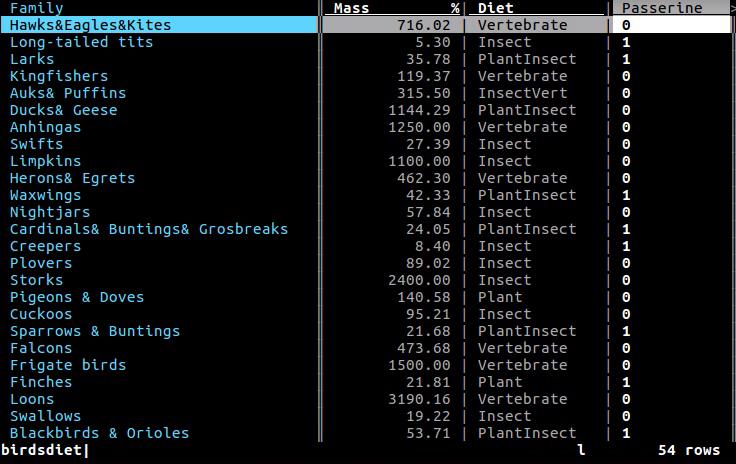
|
|||||||||||
6. Select rows by regex where the
|
|
|||||||||||
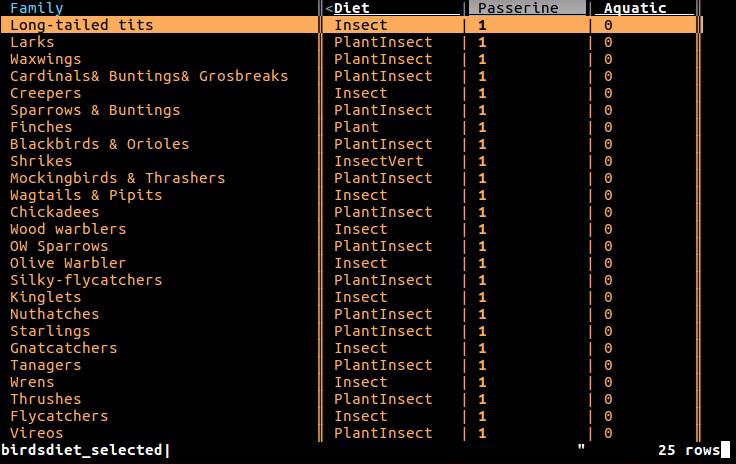
7. Push a new sheet of only the selected rows with " |
|
|||||||||||
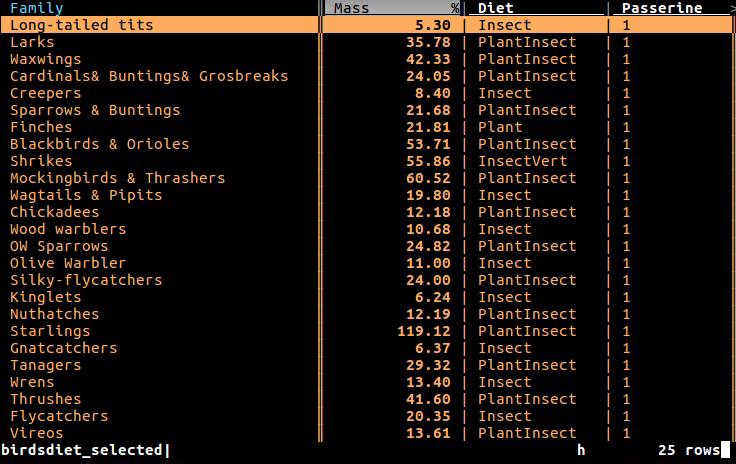
8. Go to the Mass column with h |
|
|||||||||||
9. Choose to aggregate the average
|
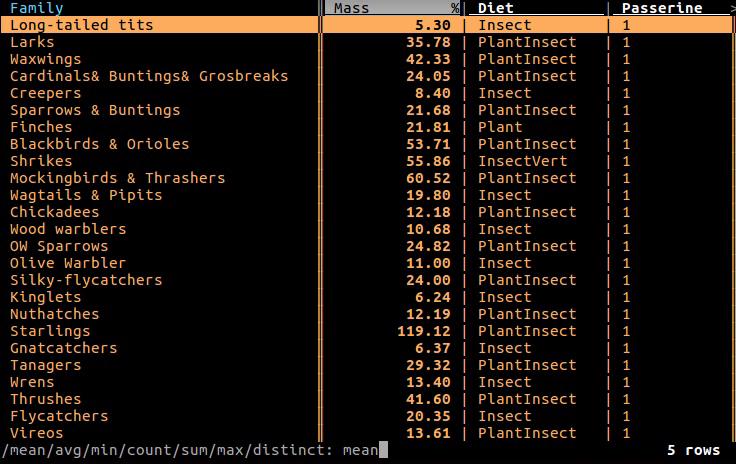
|
|||||||||||
10. Go to the Diet column (with l ) |
|
|||||||||||
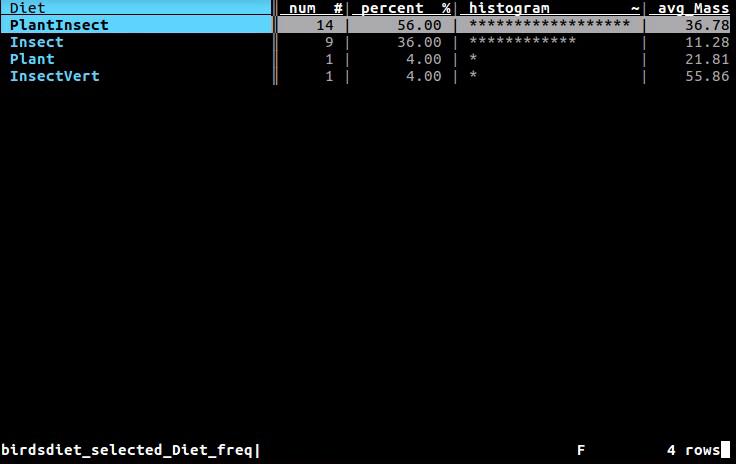
11. Push a frequency table sheet for the This sheet adds an aggregated column for every column with an aggregation function. |
|
|||||||||||
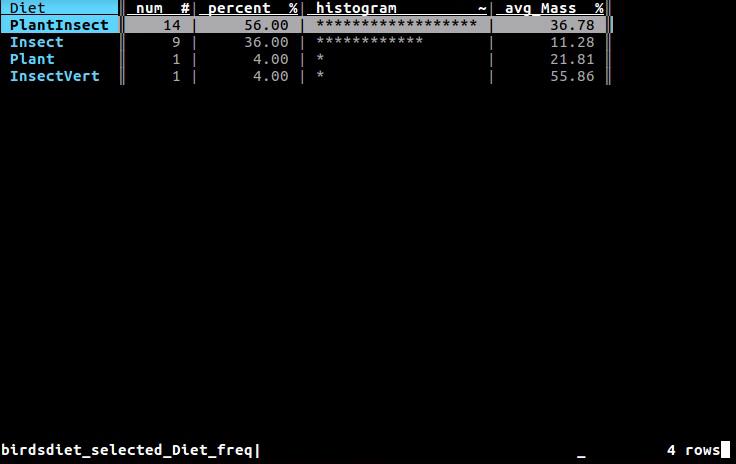
12. Minimize the Diet column to fit the longest value with _ |
|
|||||||||||
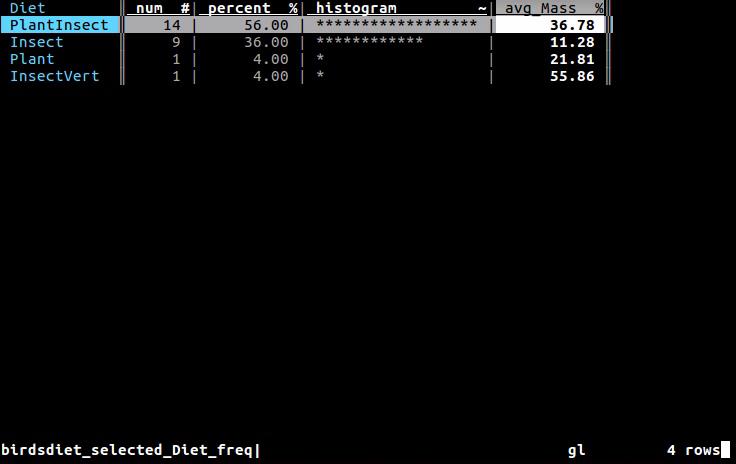
13. Go to the rightmost column with gl |
|
|||||||||||
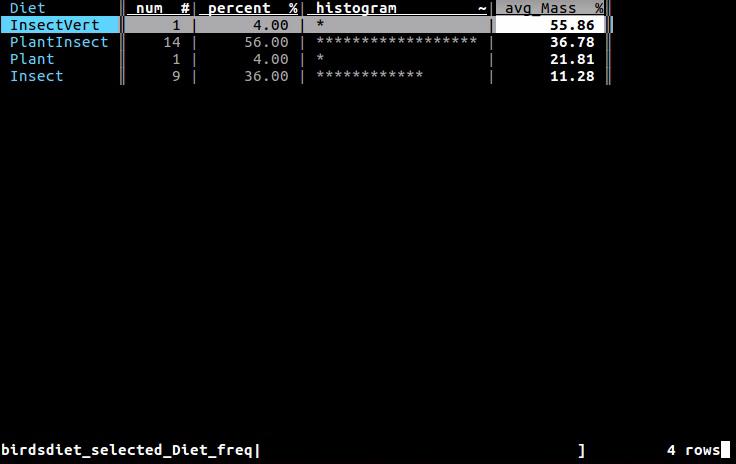
14. Sort the rows by descending avg_Mass with ] |
|
|||||||||||
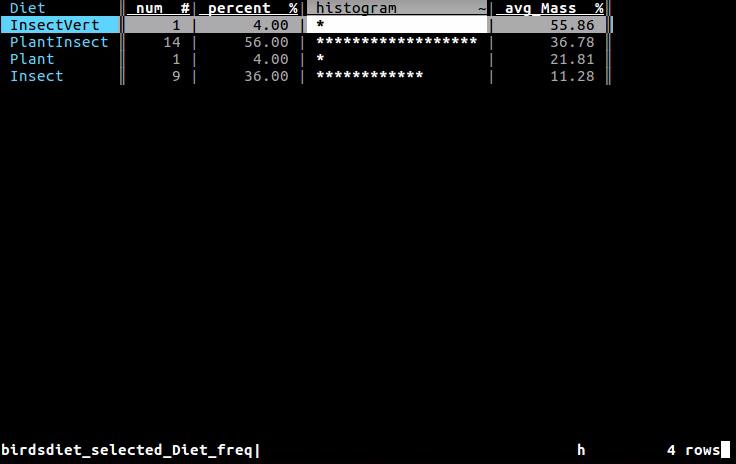
15. Go to the histogram column (with h ) |
|
|||||||||||
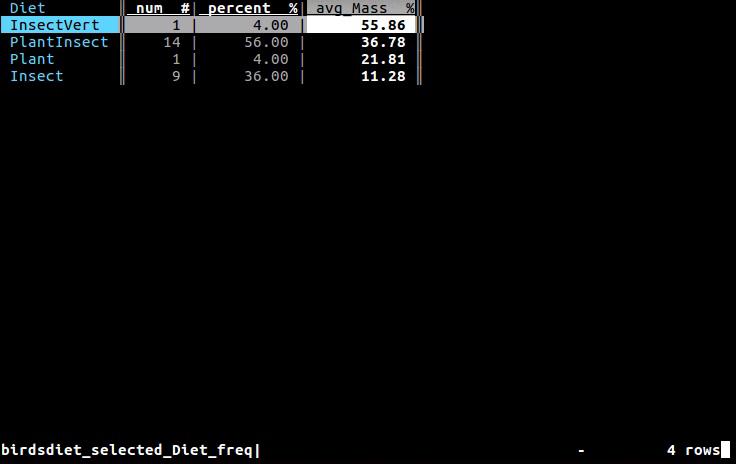
16. Hide the histogram column (with - ) |
|
|||||||||||
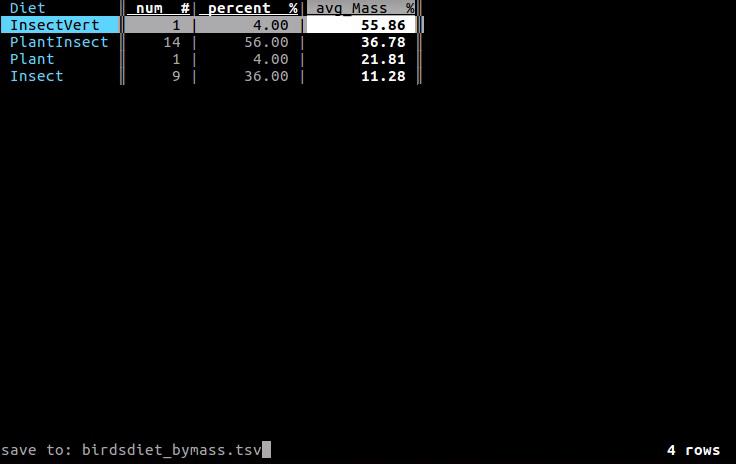
17. Save the current sheet to .tsv with Ctrl-s followed by ENTER |
|
|||||||||||
18. View e’D’itlog with The editlog lists every action taken since the program started. |
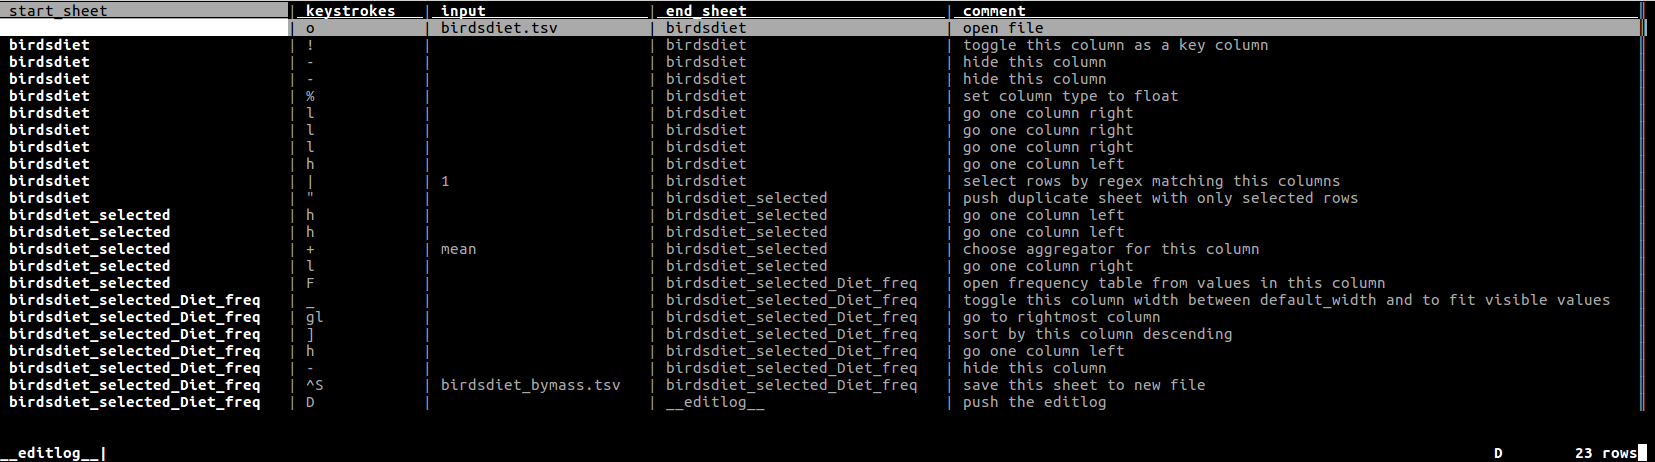
|
|||||||||||
19. Exit VisiData with gq |

|
|||||||||||